3 Tidyverse

Tidyverse เป็น package ซึ่งนิพนธ์โดย Haley Wickham และคณะ โดย function ส่วนใหญ่ใน tidyverse นั้นเกี่ยวข้องกับการปรับแต่งข้อมูลจาก dataframe ซึ่งจะอำนวยความสะดวกให้เราสามารถทำงานได้มากขึ้นกว่าการใช้ base R ข้อเสียของ tidyverse นั้น อาจจะทำให้ run ช้ากว่า และมีปรับแต่งให้ตรงกับการใช้งานจำเพาะได้ยากกว่า แต่สำหรับผู้ที่ไม่ใช่ R hardcore นั้น tidyverse ถือว่าเป็น package ที่อำนวยความสะดวกได้อย่างดีเยี่ยม
โดย tidyverse นั้นจะเป็น package ใหญ่ และจะแบ่งเป็นหลาย package ย่อยๆ ได้อีก โดยเราสามารถเรียกใช้ ทั้งหมดได้ หรือ เรียกใช้แค่ package ย่อย
3.1 dplyr
dplyr คือ package ย่อยของ tidyverse ซึ่งทำหน้าที่ในส่วน dataframe manipulation ทำให้เราสามารถดึงตารางออกมาได้อย่างอิสระ
การใช้งาน package ข้างนอกนั้นจะต้อง install ก่อน และเมื่อใช้งาน จะต้องใช้คำสั่ง library
# install.packages('tidyverse') รันคำสั่งนี้ก่อนถ้ายังไม่เคย install
library(dplyr)  # ต้อง run ทุกครั้งที่จะใช้งาน
ในกรณีนี้จะใช้ข้อมูลตัวอย่าง iris เพื่อสาธิตการใช้ dplyr โดย iris เป็นข้อมูลของความยาวกลีบของพันธุ์ดอกไม้ต่างๆ

รูปจาก: https://www.datacamp.com/tutorial/machine-learning-in-r
df <- iris  # โหลด dataframe ตัวอย่างที่ติดมากับ base R
head(df, 5)
function หลักๆ ของ dplyr จะเกี่ยวข้องกับ data manipulation เป็นส่วนใหญ่ ในที่นี้จะแนะนำที่จำเป็นต้องใช้ในบทอื่น
- glimpse() มีไว้ดูภาพรวมข้อมูล
glimpse(df)## Rows: 150
## Columns: 5
## $ Sepal.Length <dbl> 5.1, 4.9, 4.7, 4.6, 5.0, 5.4, 4.6, 5.0, 4.4, 4.9, 5.4, 4.8, 4.8, 4.3, 5.8, 5.7, 5.4, 5.1, 5.…
## $ Sepal.Width <dbl> 3.5, 3.0, 3.2, 3.1, 3.6, 3.9, 3.4, 3.4, 2.9, 3.1, 3.7, 3.4, 3.0, 3.0, 4.0, 4.4, 3.9, 3.5, 3.…
## $ Petal.Length <dbl> 1.4, 1.4, 1.3, 1.5, 1.4, 1.7, 1.4, 1.5, 1.4, 1.5, 1.5, 1.6, 1.4, 1.1, 1.2, 1.5, 1.3, 1.4, 1.…
## $ Petal.Width <dbl> 0.2, 0.2, 0.2, 0.2, 0.2, 0.4, 0.3, 0.2, 0.2, 0.1, 0.2, 0.2, 0.1, 0.1, 0.2, 0.4, 0.4, 0.3, 0.…
## $ Species <fct> setosa, setosa, setosa, setosa, setosa, setosa, setosa, setosa, setosa, setosa, setosa, seto…- select() เลือก column ที่ต้องการโดยใช้ตำแหน่งหรือชื่อ column ก็ได้
df %>%
    select(Species) %>%
    head(5)  # เลือก column 'Species'
df %>%
select(2) %>%
head(5) # เลือก column ที่ 2df %>%
select(1:2) %>%
head(5) # เลือก 2 column- filter() กรองแถว (row) ที่ต้องการ โดยต้องระบุ ว่าต้องการข้อมูล ที่ column ไหน และต้องการกรองค่าที่เท่าไร
# เลือกแถวที่ Species == virginica
df %>%
    filter(Species == "virginica") %>%
    head(5)
# เลือกแถวที่ Species = setosa, Sepal.Length = 5.4
df %>%
filter(Species == "setosa" & Sepal.Length == 5.4) %>%
head(5)# เลือกแถวที่ Sepal.Lenght = 5.1 หรือ 4.9
df %>%
filter(Sepal.Length == 5.1 | Sepal.Length == 4.9) %>%
head(10)สังเกตว่าจะเห็นเครื่องหมาย %>% ซึ่งใน R เราจะเรียกว่า “pipe operator” เป็นสิ่งที่เป็นเอกลักษณ์ใน R ซึ่งส่งผลให้สามารถ run operation ได้ต่อๆ กัน เพื่อให้อ่านได้ง่าย
# เลือกแถวที่ Species = setosa คอลัมน์ Sepal.Length
df %>%
    filter(Species == "setosa") %>%
    select(Sepal.Length) %>%
    head(5)
# เหมือนกับข้างบน แต่ไม่ใช้ pipe operator จะทำความเข้าใจได้ยากกว่า
select(filter(df, Species == "setosa"), Sepal.Length) %>%
head(5)# ใช้แค่ base R solution จะไม่สามารถดึงออกมาเป็น dataframe ได้
df[df["Species"] == "setosa", "Sepal.Length"]## [1] 5.1 4.9 4.7 4.6 5.0 5.4 4.6 5.0 4.4 4.9 5.4 4.8 4.8 4.3 5.8 5.7 5.4 5.1 5.7 5.1 5.4 5.1 4.6 5.1 4.8 5.0 5.0
## [28] 5.2 5.2 4.7 4.8 5.4 5.2 5.5 4.9 5.0 5.5 4.9 4.4 5.1 5.0 4.5 4.4 5.0 5.1 4.8 5.1 4.6 5.3 5.0บรรทัดสุดท้าย สำหรับ dataframe จะไม่สามารถดึงมาทั้ง column ได้ ซึ่งจะต้องใช้ข้อมูลอีกแบบ (tibble) แต่จะไม่พูดถึง ณ ที่นี่
Note: การ subset โดย dplyr นั้นสามารถทำใน dataframe/tibble เท่านั้น ไม่สามารถทำใน matrix ได้ (ต้องใช้วิธีของ base R)
- ในส่วนการเรียงข้อมูลนั้นจะใช้ function arrange()
df %>%
    arrange(Sepal.Length) %>%
    head(5)  # เรียง Sepal.Length จากน้อยไปมาก
df %>%
arrange(desc(Sepal.Length)) %>%
head(5) # เรียง Sepal.Length จากมากไปน้อย- เราสามารถจัดกลุ่มตัวแปรได้โดยใช้ group_by() โดยมักจะใช้คู่กับ summarize()
df %>%
  group_by(Species) %>% #จัดกลุ่มตาม Species
  summarize(Sepal.Length = sum(Sepal.Length), Sepal.Width = sum(Sepal.Width)) #รวมความยาวทั้งหมด
3.2 ggplot2
ggplot2 คือ package ย่อยอีกตัวของ tidyverse ซึ่งใช้สำหรับการ plot graph
3.2.1 Anatomy of ggplot
ggplot(data = data, aes(x = x, y = y, col = col, fill = fill)) + geom_xxx() + theme_xxx()- aes คือ aesthetic ซึ่งหมายถึงการ map ข้อมูลของเราเข้ากับตำแหน่งของกราฟ
x = แกน x, y = แกน y
col = สี, fill = สีพื้นหลัง
- geom_xxx() คือ การกำหนดว่าเราต้องการที่จะ plot กราฟอะไร
geom_point() = scatterplot
geom_line() = lineplot
geom_boxplot() = boxplot
- theme_xxx() คือ การกำหนด theme ของกราฟ เช่น theme_bw(), theme_classic()
- และยังมีการปรับแต่งอื่นๆ ได้อีกมาก สามารถศึกษาได้ที่ https://ggplot2.tidyverse.org/reference/
3.2.2 Scatterplot
# install.packages('tidyverse') รันคำสั่งนี้ก่อนถ้ายังไม่เคย install
library(ggplot2)

ggplot(df, aes(x = Sepal.Width, y = Sepal.Length, col = Species)) + geom_point()
3.2.3 Barchart
ใช้สำหรับนับจำนวนของ column นั้น ไม่มีค่า y
ggplot(df, aes(x = Species, fill = Species)) + geom_bar() # fill ไว้สำหรับแบ่งสีใน barchart
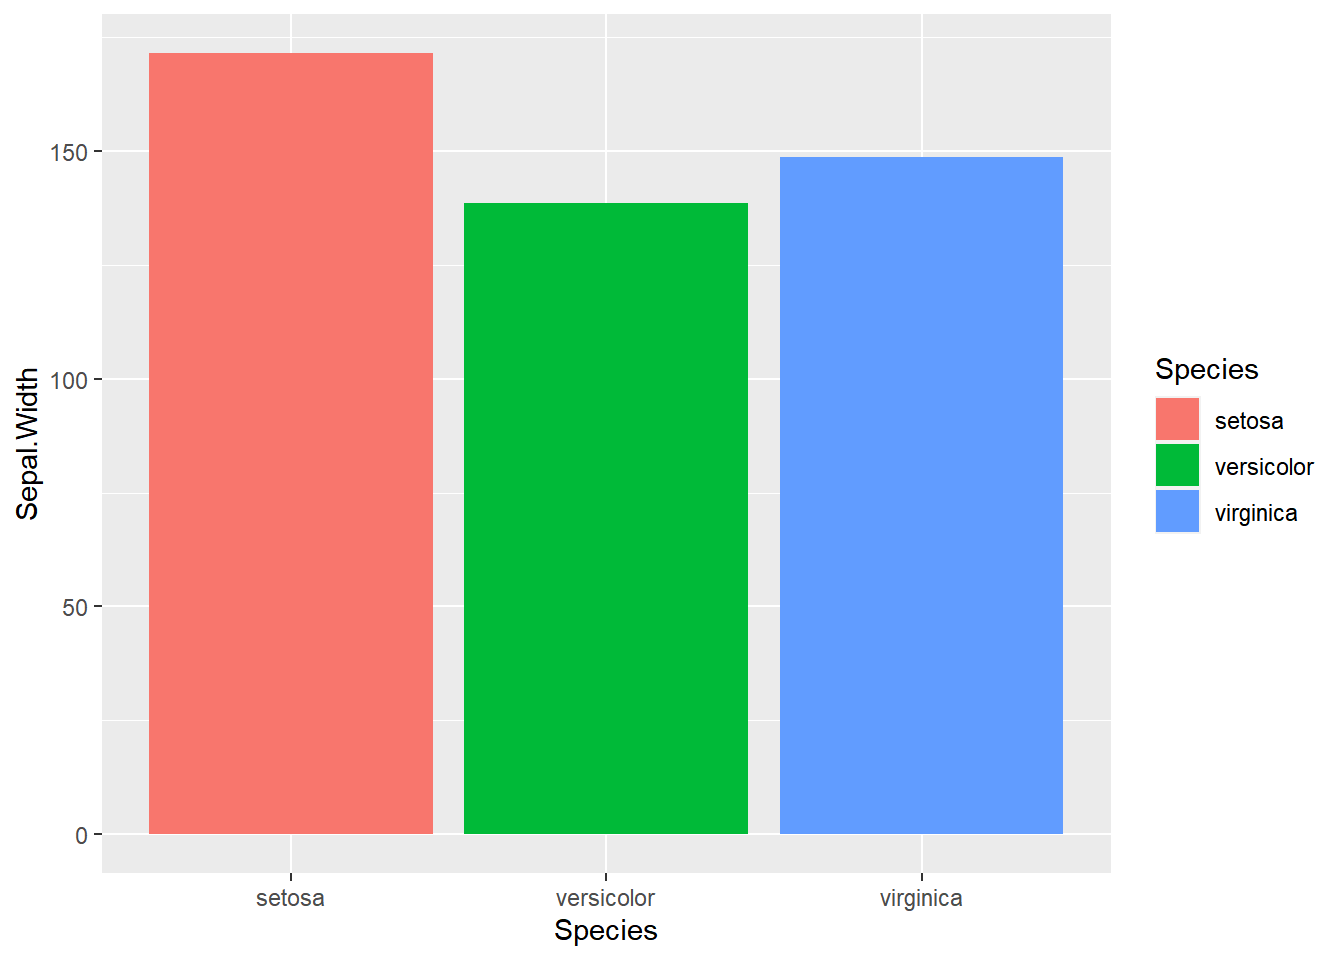
ส่วน geom_col() จะรับค่า y ด้วย โดยข้อมูล x ที่ซ้ำกันจะถูกนำมารวมกัน (สามารถปรับแต่งได้เพิ่มเติม)
ggplot(df, aes(x = Species, y = Sepal.Width, fill = Species)) + # fill ไว้สำหรับแบ่งสีใน barchart
geom_col() 
